
Content and your business objectives
Working with content management for the past twenty years, I’ve had the good luck (and still do) of working closely with many skilled marketers, content marketers, analysts, and sales people. From a content point of view, all of the above roles work in a different way with content. The marketer is interested in using content in marketing campaigns. The content marketer is focused on creating thought leadership and content that resonates with the customer’s intent and needs. The analyst is looking at content performance and trying to optimize traffic. The sales person is interested in getting sales-ready leads by having great content available that can attract the right leads and provide support along the sales process.
Understanding the value of content toward your business objectives is critical, especially for those who are on a journey to invest more in creating content that is outside-in rather than inside-out (which means the type of content that mentions the brand every ten words, has lots of ®, TM, etc.).
Understanding the type of content that engages customers based on their needs and how it contributes to value can help you make the right investments toward creating more quality content, as well as getting it marketed through the right channels.
Based on understanding the value of content or assets (video, PDFs, etc.) on your site, you want to:
- drive more traffic to content that converts visitors to your most important goals (high-value content);
- optimize engagement for content that has many visits but doesn’t drive conversions (low-value content).
The more data you have available, the better you can optimize for the above by adjusting your digital marketing mix.
Typically, different tools are involved in measuring the impact of content and different tactics are employed, depending on which role you are in. In general, most start the forensic analysis by going into their analytics tool (e.g., Google Analytics), with which the analyst can go a step deeper than the other roles, by, for example, creating and applying segmentation, diving into data details, and identifying opportunities for optimization. Other roles use other out-of-the-box reports, by which they can see visits for content, conversion rates, bounces, etc., but these other roles would typically depend on the analyst for further details on selecting content and deciding what they should do next.
At Altola, we are determined to simplify this. The simpler it is to get the right recommendations, the faster you can act and reap the value of optimization. So we dedicated our first lab project to getting the right insights faster, along with recommended next steps. We want to make it easy to go from insights to action without having multiple roles involved.
Another mission for the project is to helps us be more effective with the customers who consult with us. Rather than spending valuable time extracting data and analyzing in Excel or BI, we can go straight to the insights and spend more time on the actions, which benefits our customers and their businesses.
When looking at content performance, it’s common to look at visits per content, where content can be a page, an asset, or a content fragment embedded in multiple pages and sites. However, this doesn’t necessarily correlate to business success, since it’s so easy to get higher visits - give $5,000 more to your digital marketers, and they can drive more traffic.
To understand the effect of content, we also need to look at conversions attributed to the content. Most look at specific conversion rates for a select goal, but if you, like many others, have multiple goals, then you want to get the full picture of the attribution effect of your content.
One approach is to use goal conversion value, which you can enable in a number of analytics tools, such as these:
- Monetary value in Google Analytics (more insights here from Avinash Kaushik)
- Engagement value in Sitecore Experience Platform (more insights here, here, and here)
Value is great for non-ecommerce sites; if it’s an ecommerce site, then you’ll use the revenue as value (1:1 mapping), along with other goals that contribute to revenue (based on calculated value).
Value is best used when it’s correlated to real business impact, as in the following cases:
- For B2B, it would be revenue, based on visitors who convert to become customers
- For retail, it would also be revenue, based, for instance, on loyalty club and attribution to offline/online purchases
- For the government, it would typically be cost reduction by implementing self-service, since having citizens service themselves is cheaper than a phone call or someone showing up in person (DMV—happy thoughts to you…).
As an example, let’s say you are working in B2B marketing and, digitally, you have various goals:
- Talk with an expert (disguised sales call)
- Register for an event
- Sign up for industry insights (disguised newsletter)
The focus is to drive leads, which sales can connect with, and then take things from there—hopefully, to turn a lead into an opportunity and a new customer.
When looking at the above three goals—and how ready a visitor is to become a customer— talk with an expert has the highest commitment, since visitors are basically OK with a sales call, as compared with the sign up for industry insights, which shows less commitment (they’re OK with an email, as long as you don’t come knocking at their door).
To add a value for the goals in your analytics tool, you need to look at the average revenue per net new customer—let’s say that’s $12,000 (you can also add retained value YoY, based on the business you are in and the sophistication of the calculation).
Below is an example of the three goals, number of conversions, and contributed revenue:
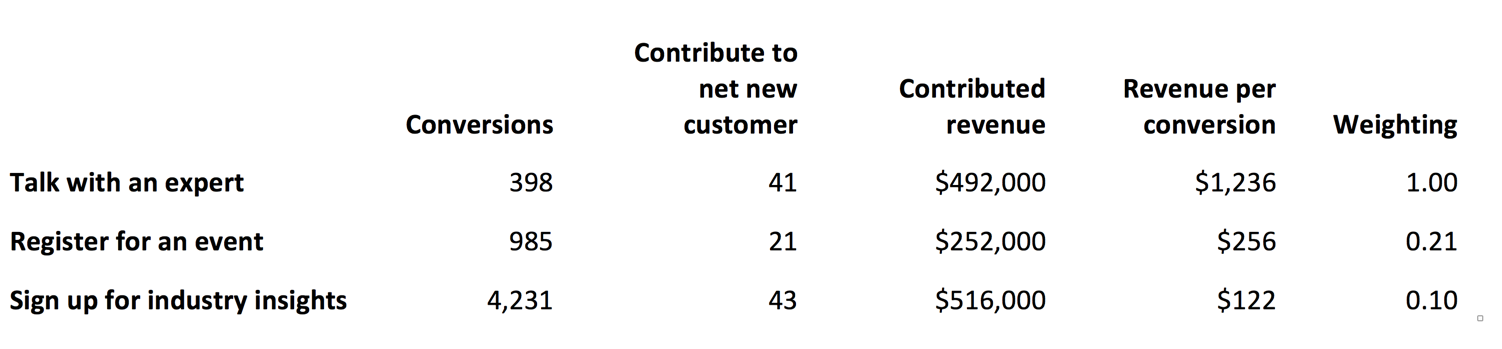
Based on this example, you can see the weighting between the goals in terms of their importance to driving revenue. You can transform this to value using your scale of choice, e.g., 0 - 10, 0 - 100, 0 - 1,000.
Small scales will limit you if you have many goals, and large scales can be too wide. A common scale of 0 - 100, with weightings applied, will give the following values per goal:
| Value | |
|---|---|
| Talk with an expert |
100 |
| Register for an event |
21 |
| Sign up for industry insights |
10 |
There’s also an option to have different value scales based on different stages of a customer journey. For example, in large B2B sales, it takes time getting someone to convert to a transactional goal (in which they exchange their data with you). Here you want to consider the conversions between the stages—and attribute that to content. For example, top-of-funnel thought leadership can be great for engaging visitors to the next step (e.g., read more content, be a return visitor) but might not convert them to transactional goals in the current interaction.
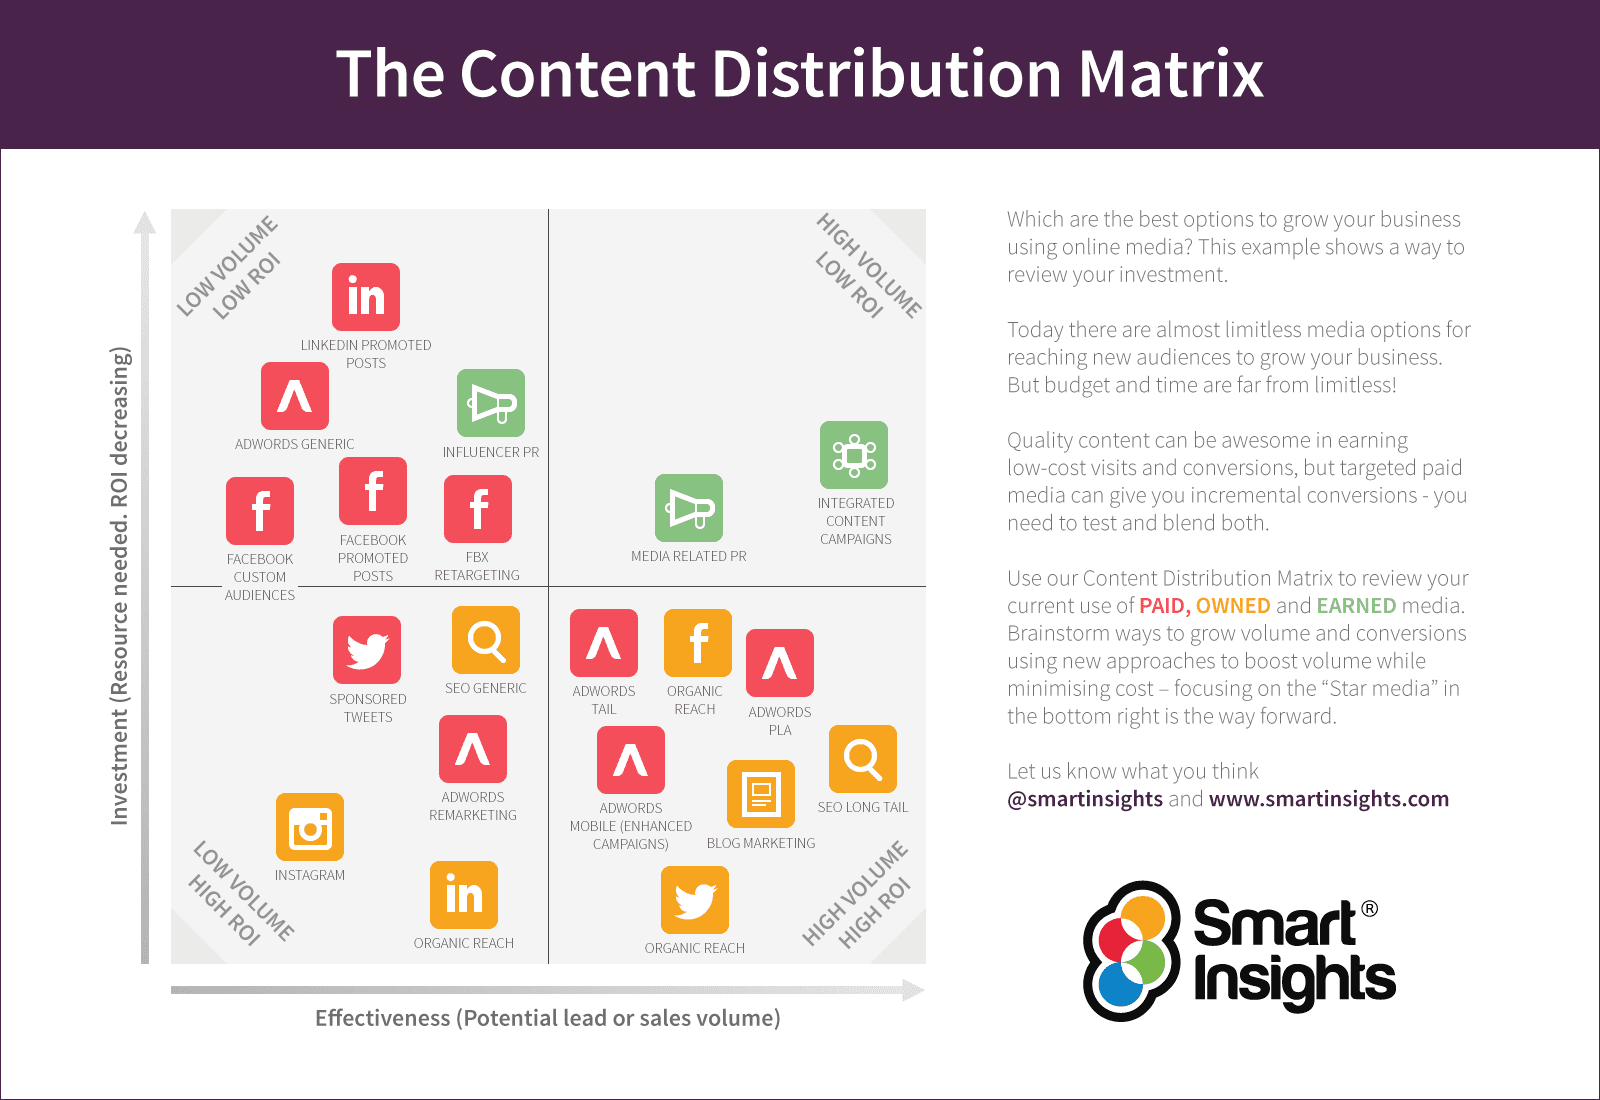
When you have content visits and value, then a great way to look at performance is to see the content in a grid, where you have “value per visit” on the x-axis and “visits” on the y-axis.
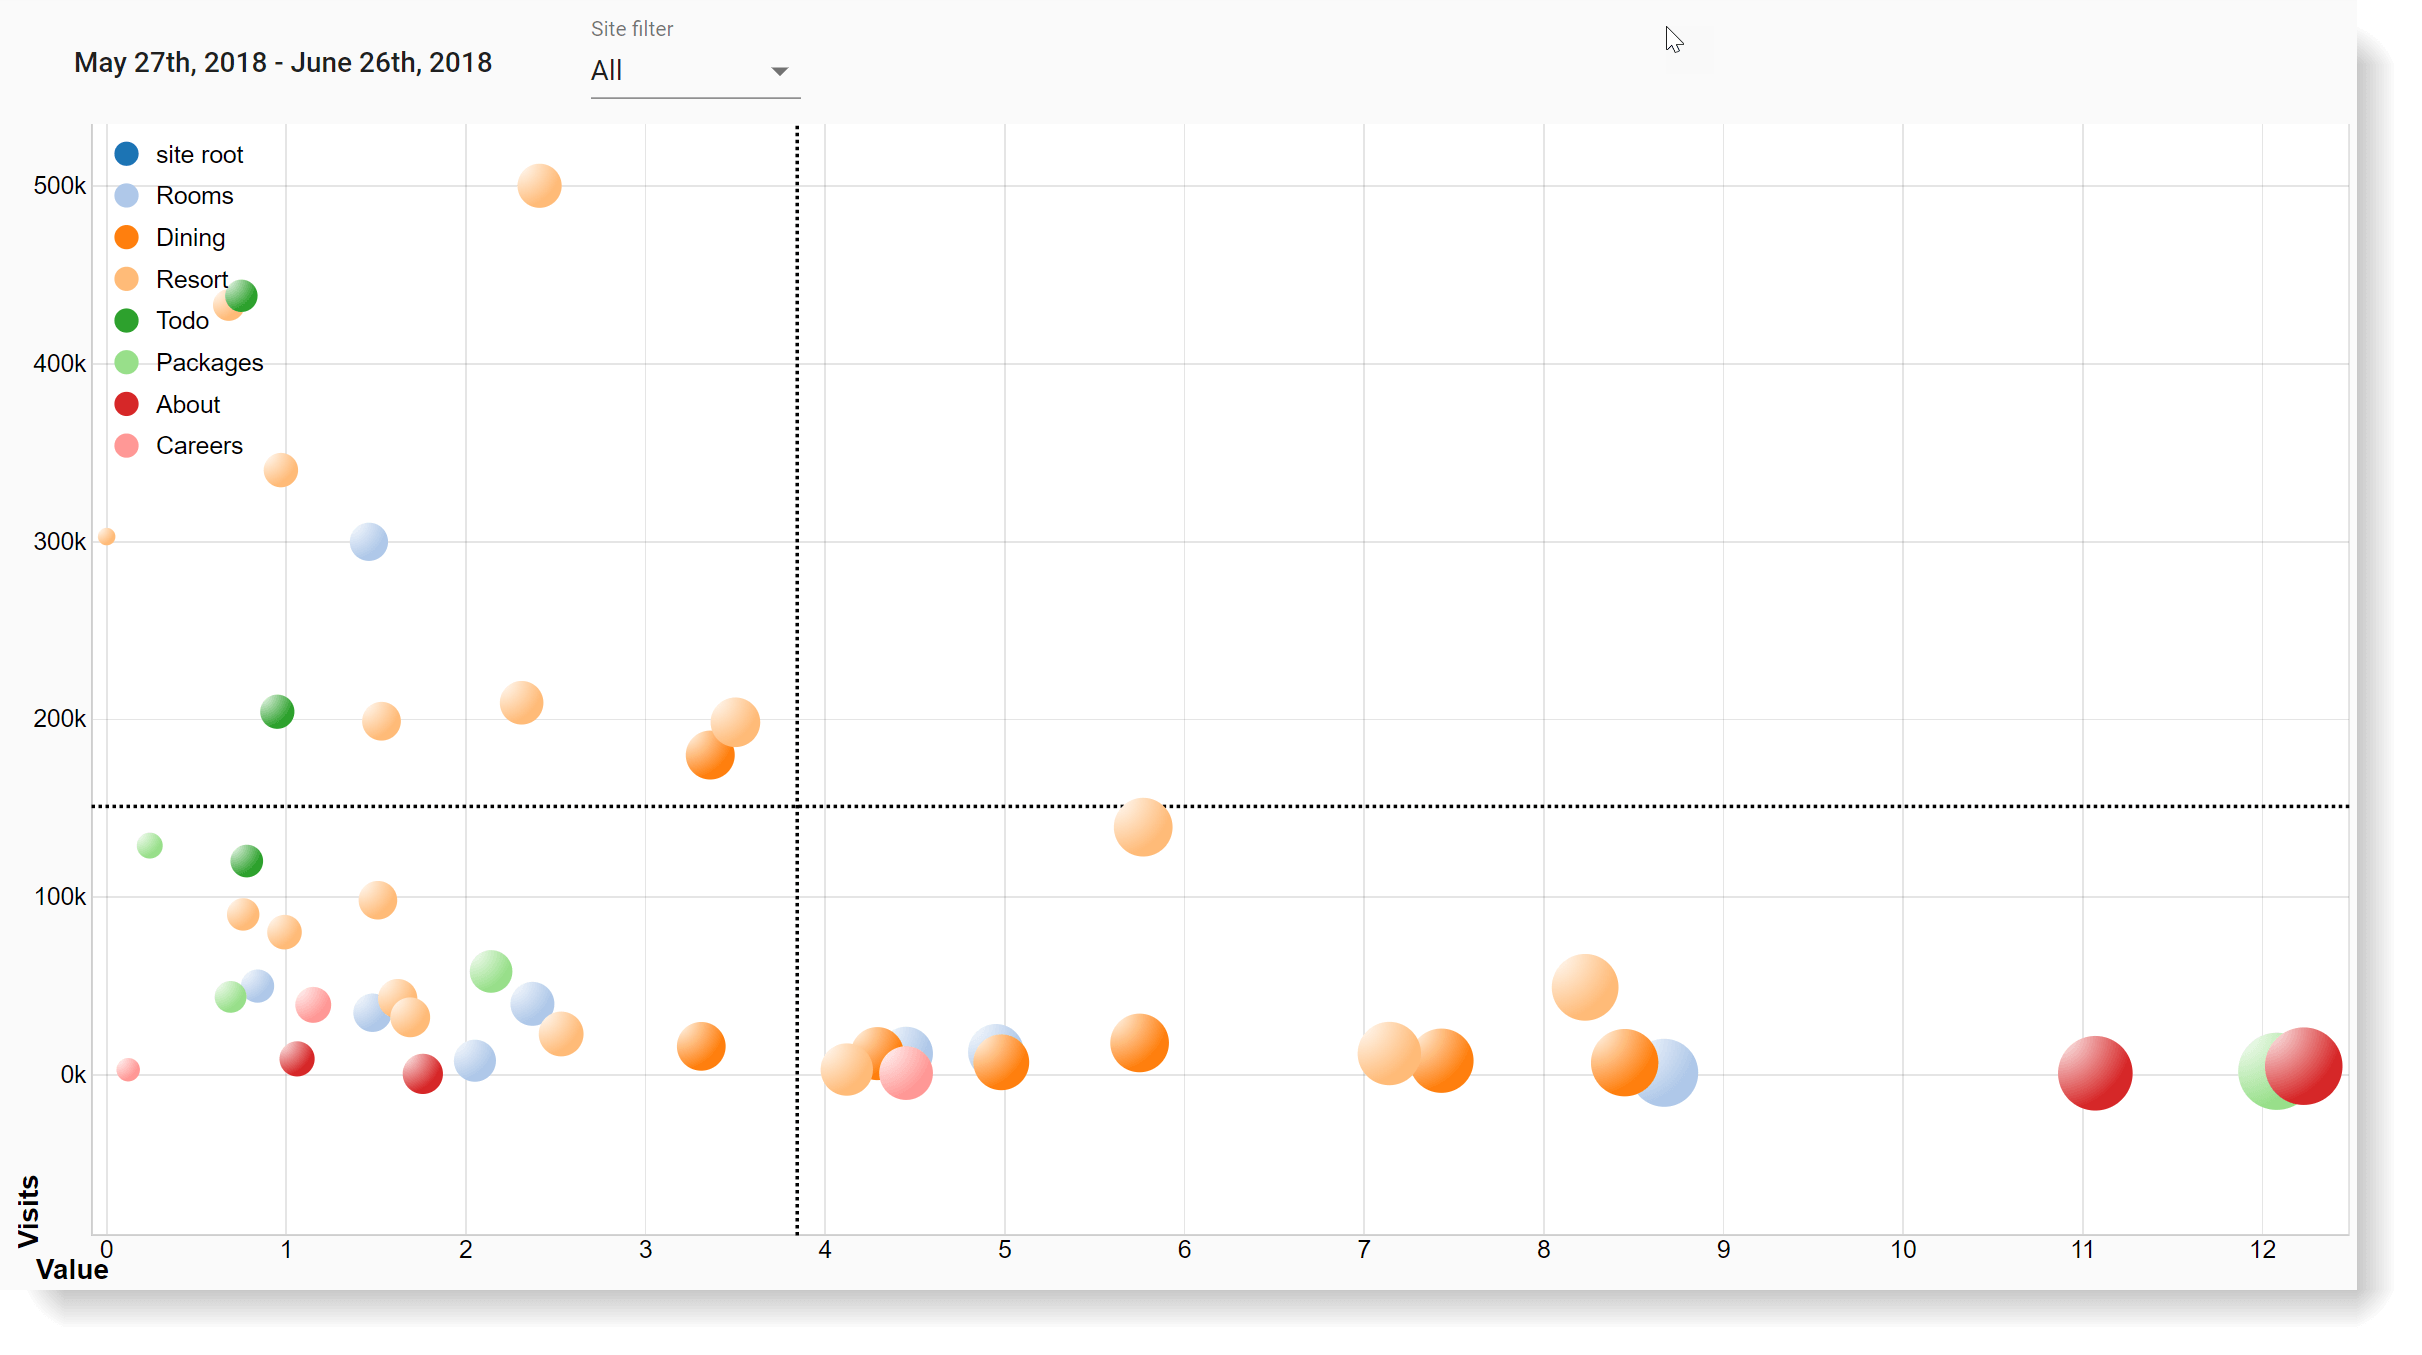
Here are some examples of this common way of looking at insights:
- Content Optimization Matrix and Smart Insights Content Distribution Matrix
- My book Connect, in which Ron Person, Chris Nash, and I explore looking at content performance in a grid
- The BCG Growth-Share Matrix that we’ve all learned in business school
The hard part with the method above is, of course, getting the data out and into the right dashboard and making it easy to act on for the business.
This is where Optimus for Sitecore XP can make it an easy task for you and your team. The only requirement is that you have the Sitecore Experience Platform with xDB enabled and that you are using the engagement value. We are always happy to help you in getting value defined and enabled.
Once you’ve installed our module (a matter of a few seconds), you can immediately see the content insights and start getting content optimization recommendations.
Optimizing for value
Here is a brief guide on how to use Optimus for Sitecore XP.
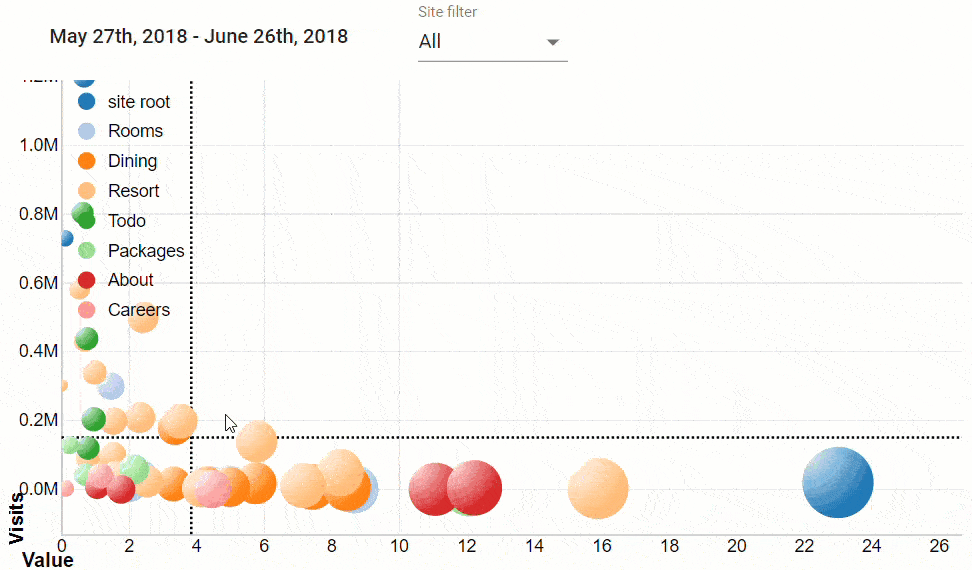
Identify where you need to optimize
High visits, low value
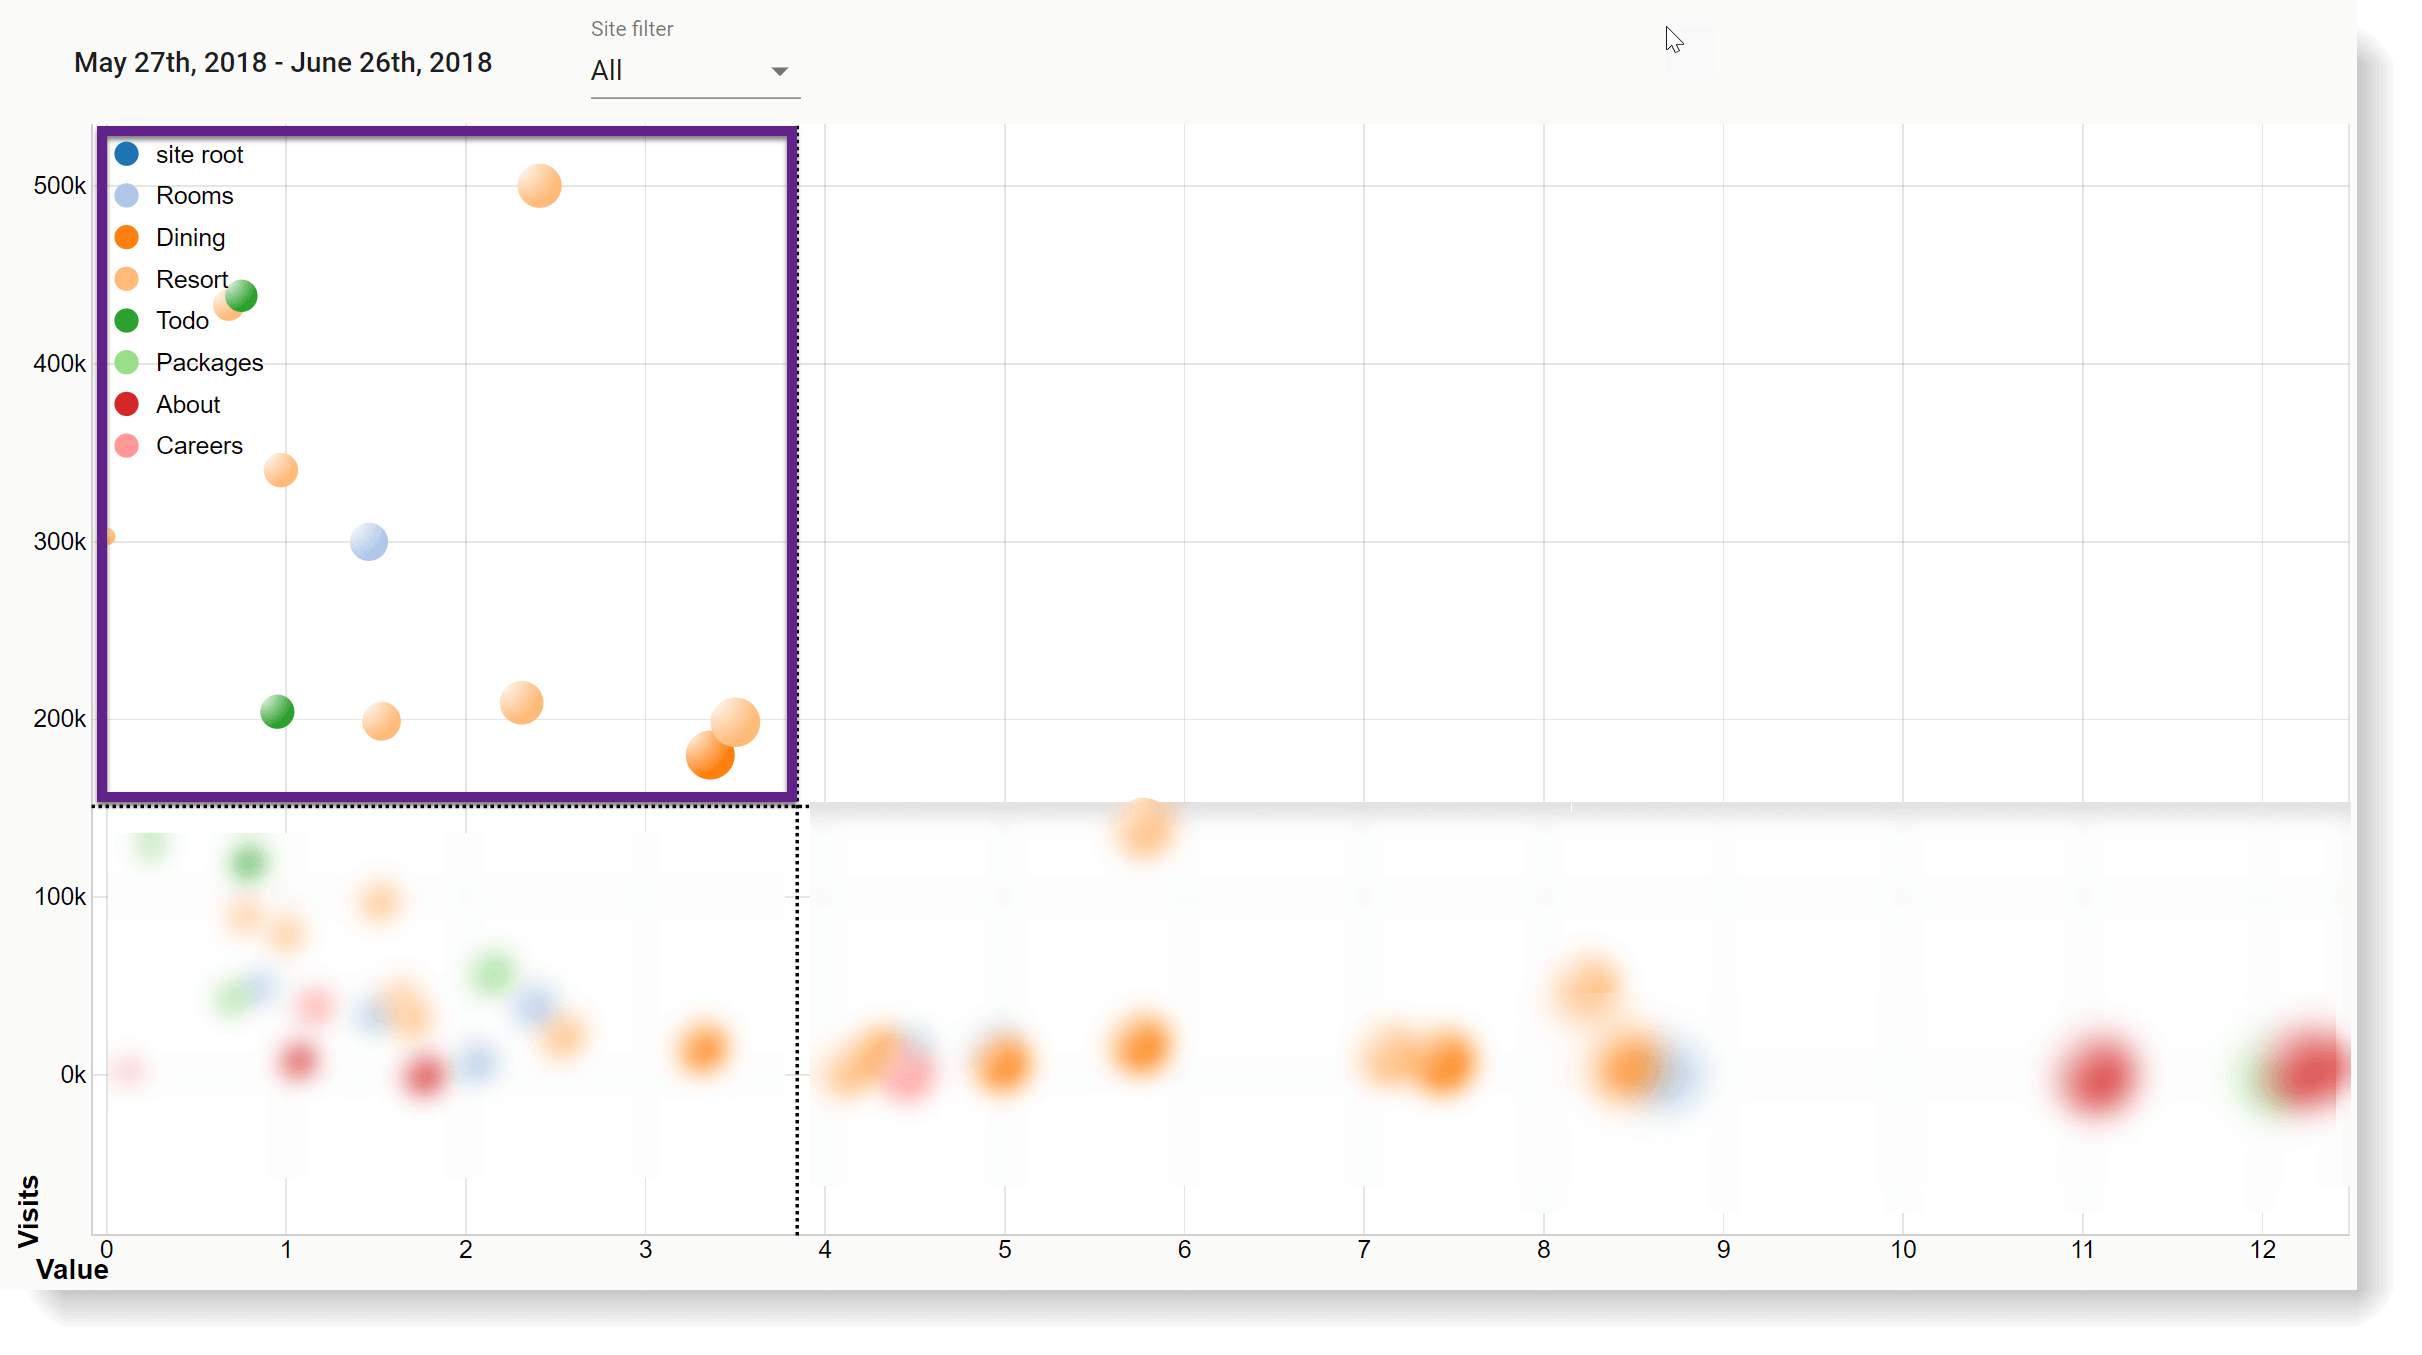
This is your biggest opportunity for understanding where you should apply personalization or testing. Focus on the content that has many visits and highest value opportunity. Based on the understanding of visitors who have consumed the content, focus on testing more relevant call-to-actions and on personalizing and guiding visitors to content that has high-value performance.
Identify those marketing efforts in which you should invest more
Low visits, high value
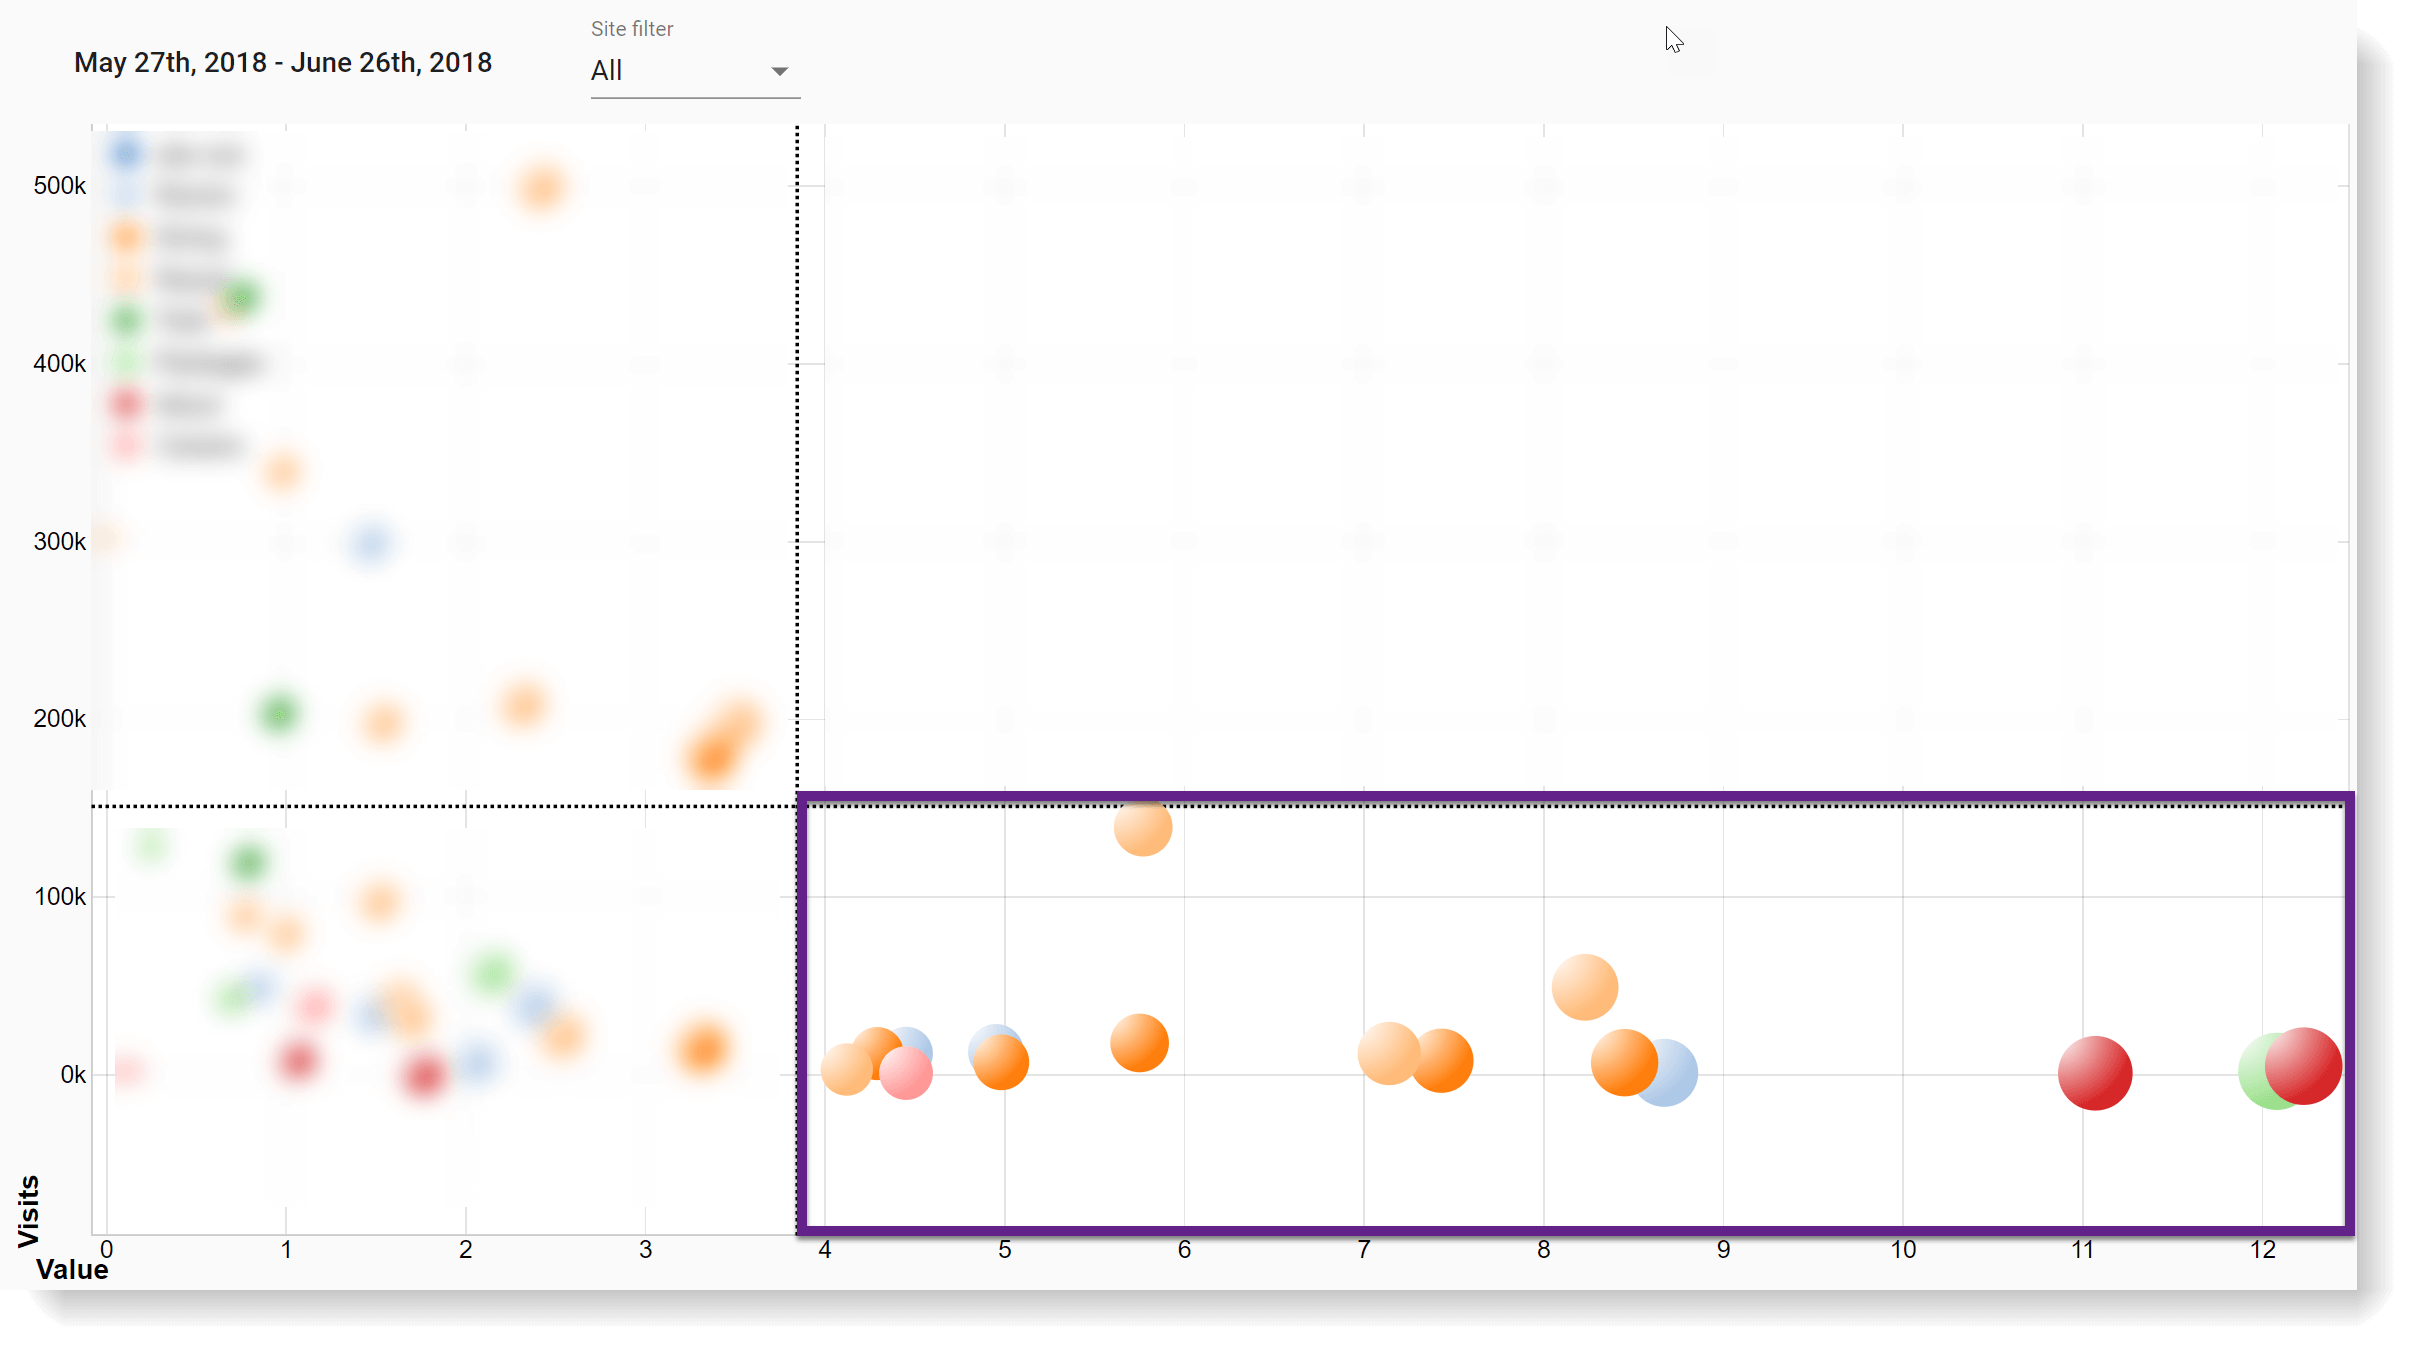
Regarding content that is low-visited but has high-value performance, invest in getting more traffic to those pages (e.g., increase spending on AdWords, include content in email nurture campaigns, and route traffic from another part of your website to this content). The more visits, the more value, which correlates directly to business impact.
Reconsider or repromote
Low visits, low value
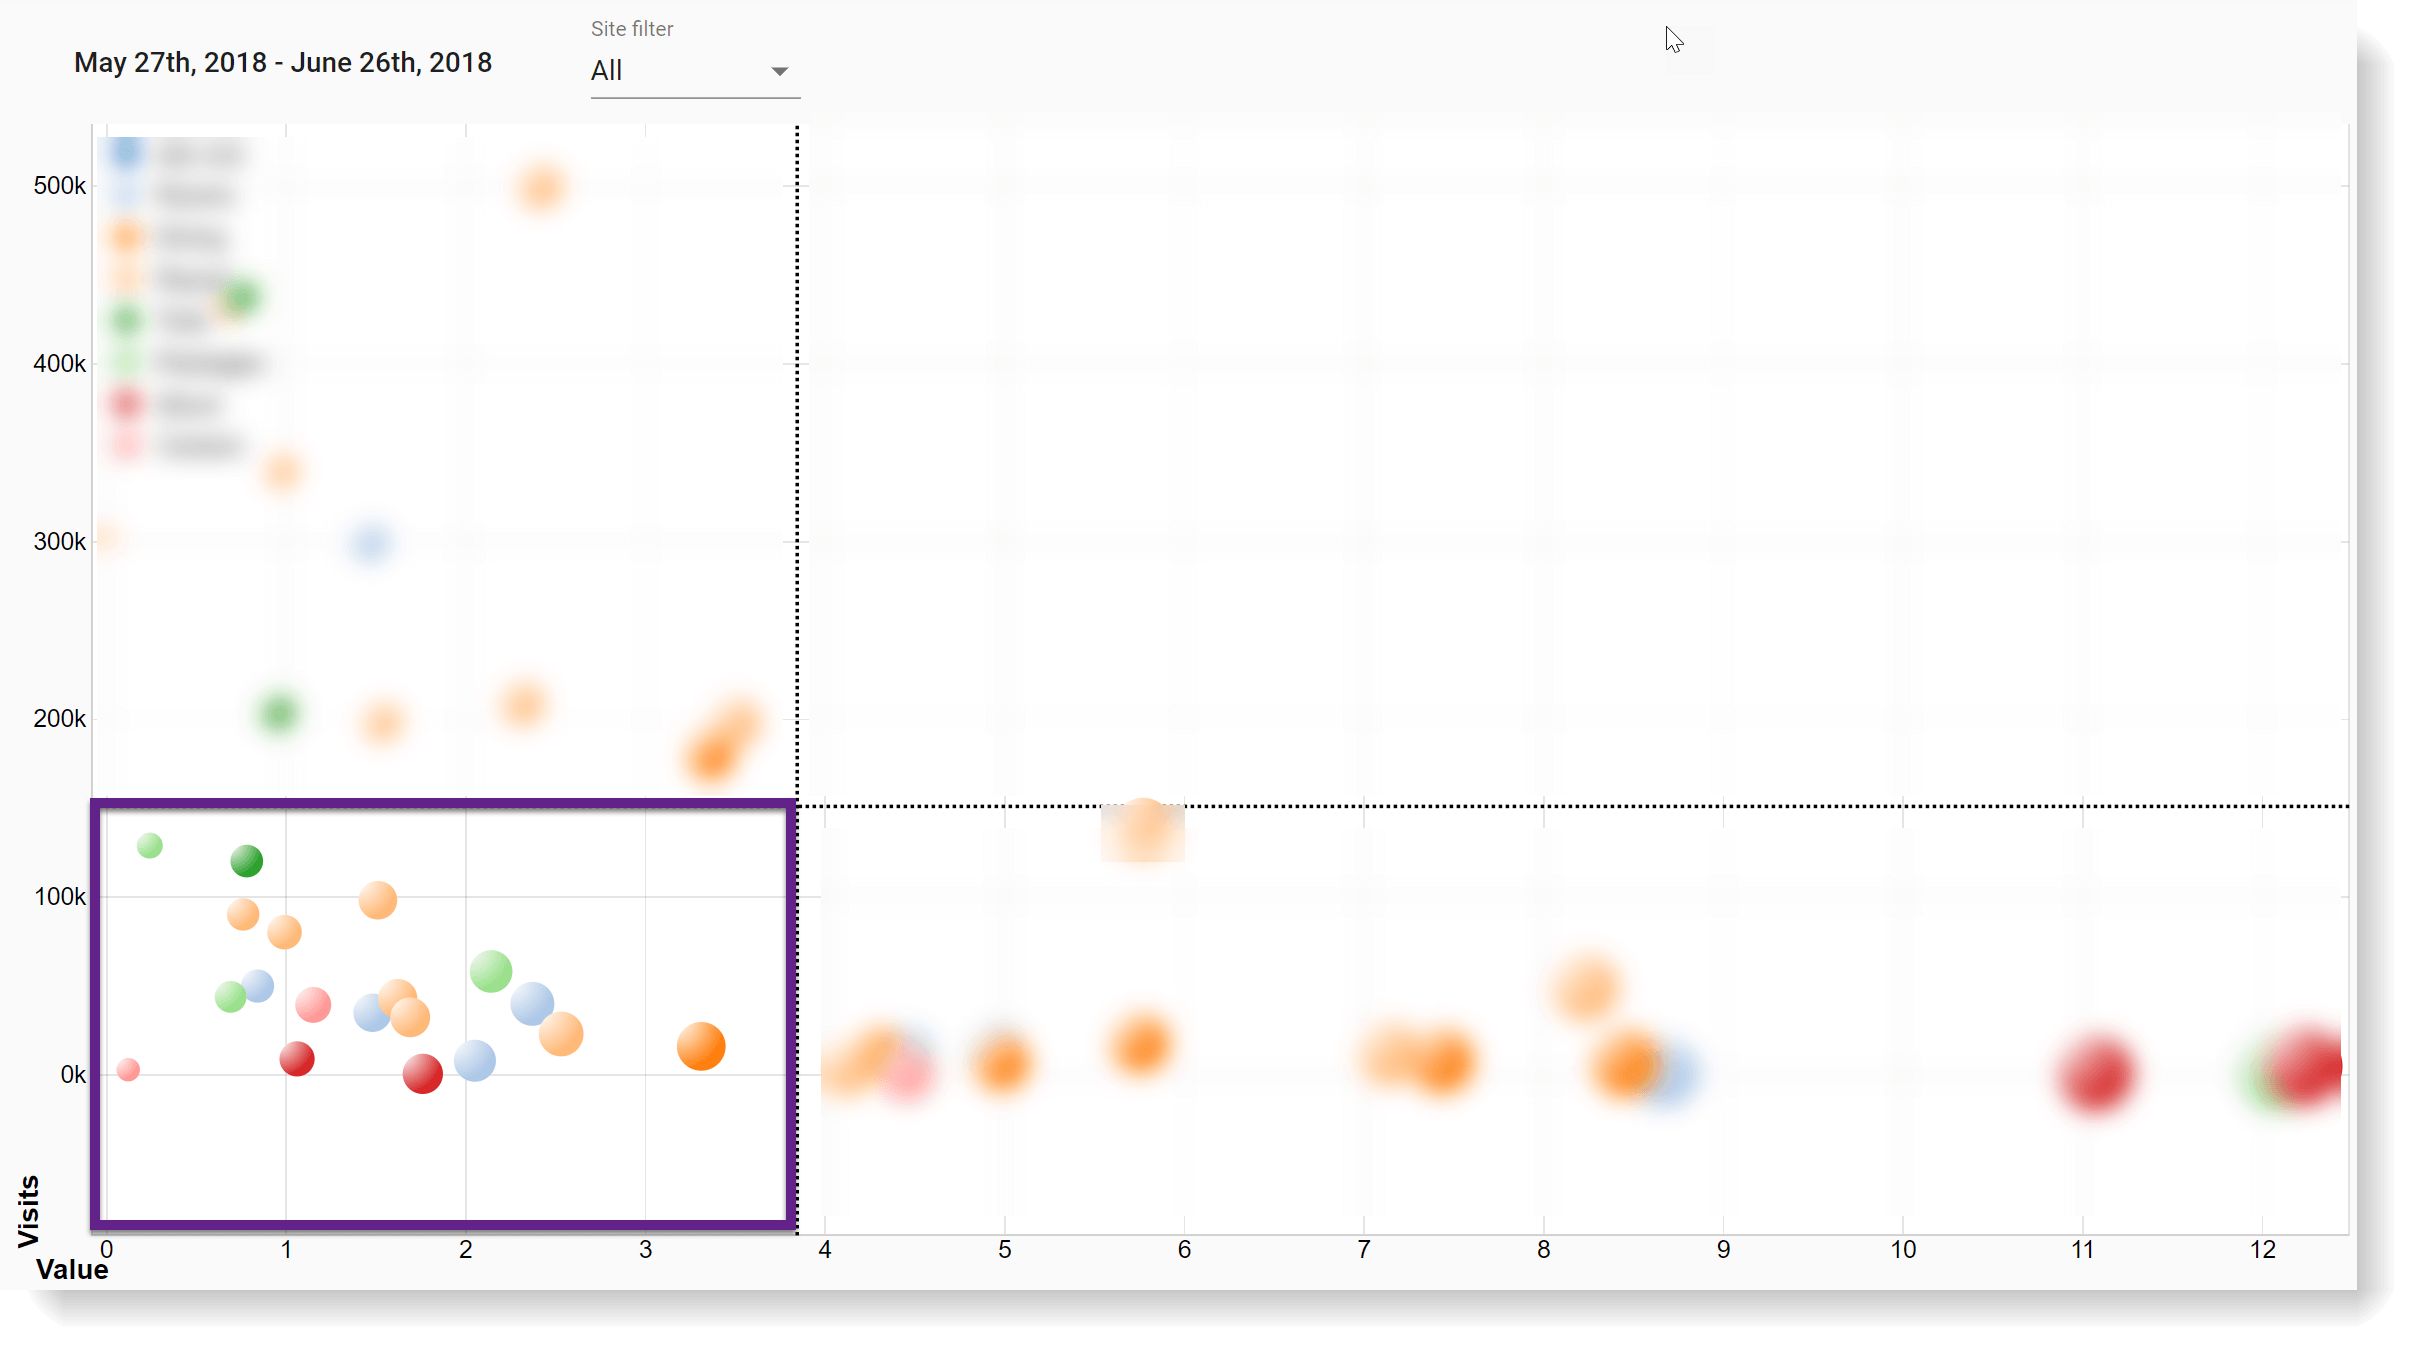
Content with low visits and low value should be analyzed thoroughly. It might make sense to keep some of it in place, but other content that constitutes important thought leadership or unique selling points for your products or services should definitely be there.
Consider repromoting content that you believe is in line with your customers’ intents and needs, and remarket content that should get more awareness.
Maintain and invest
High visits, high value
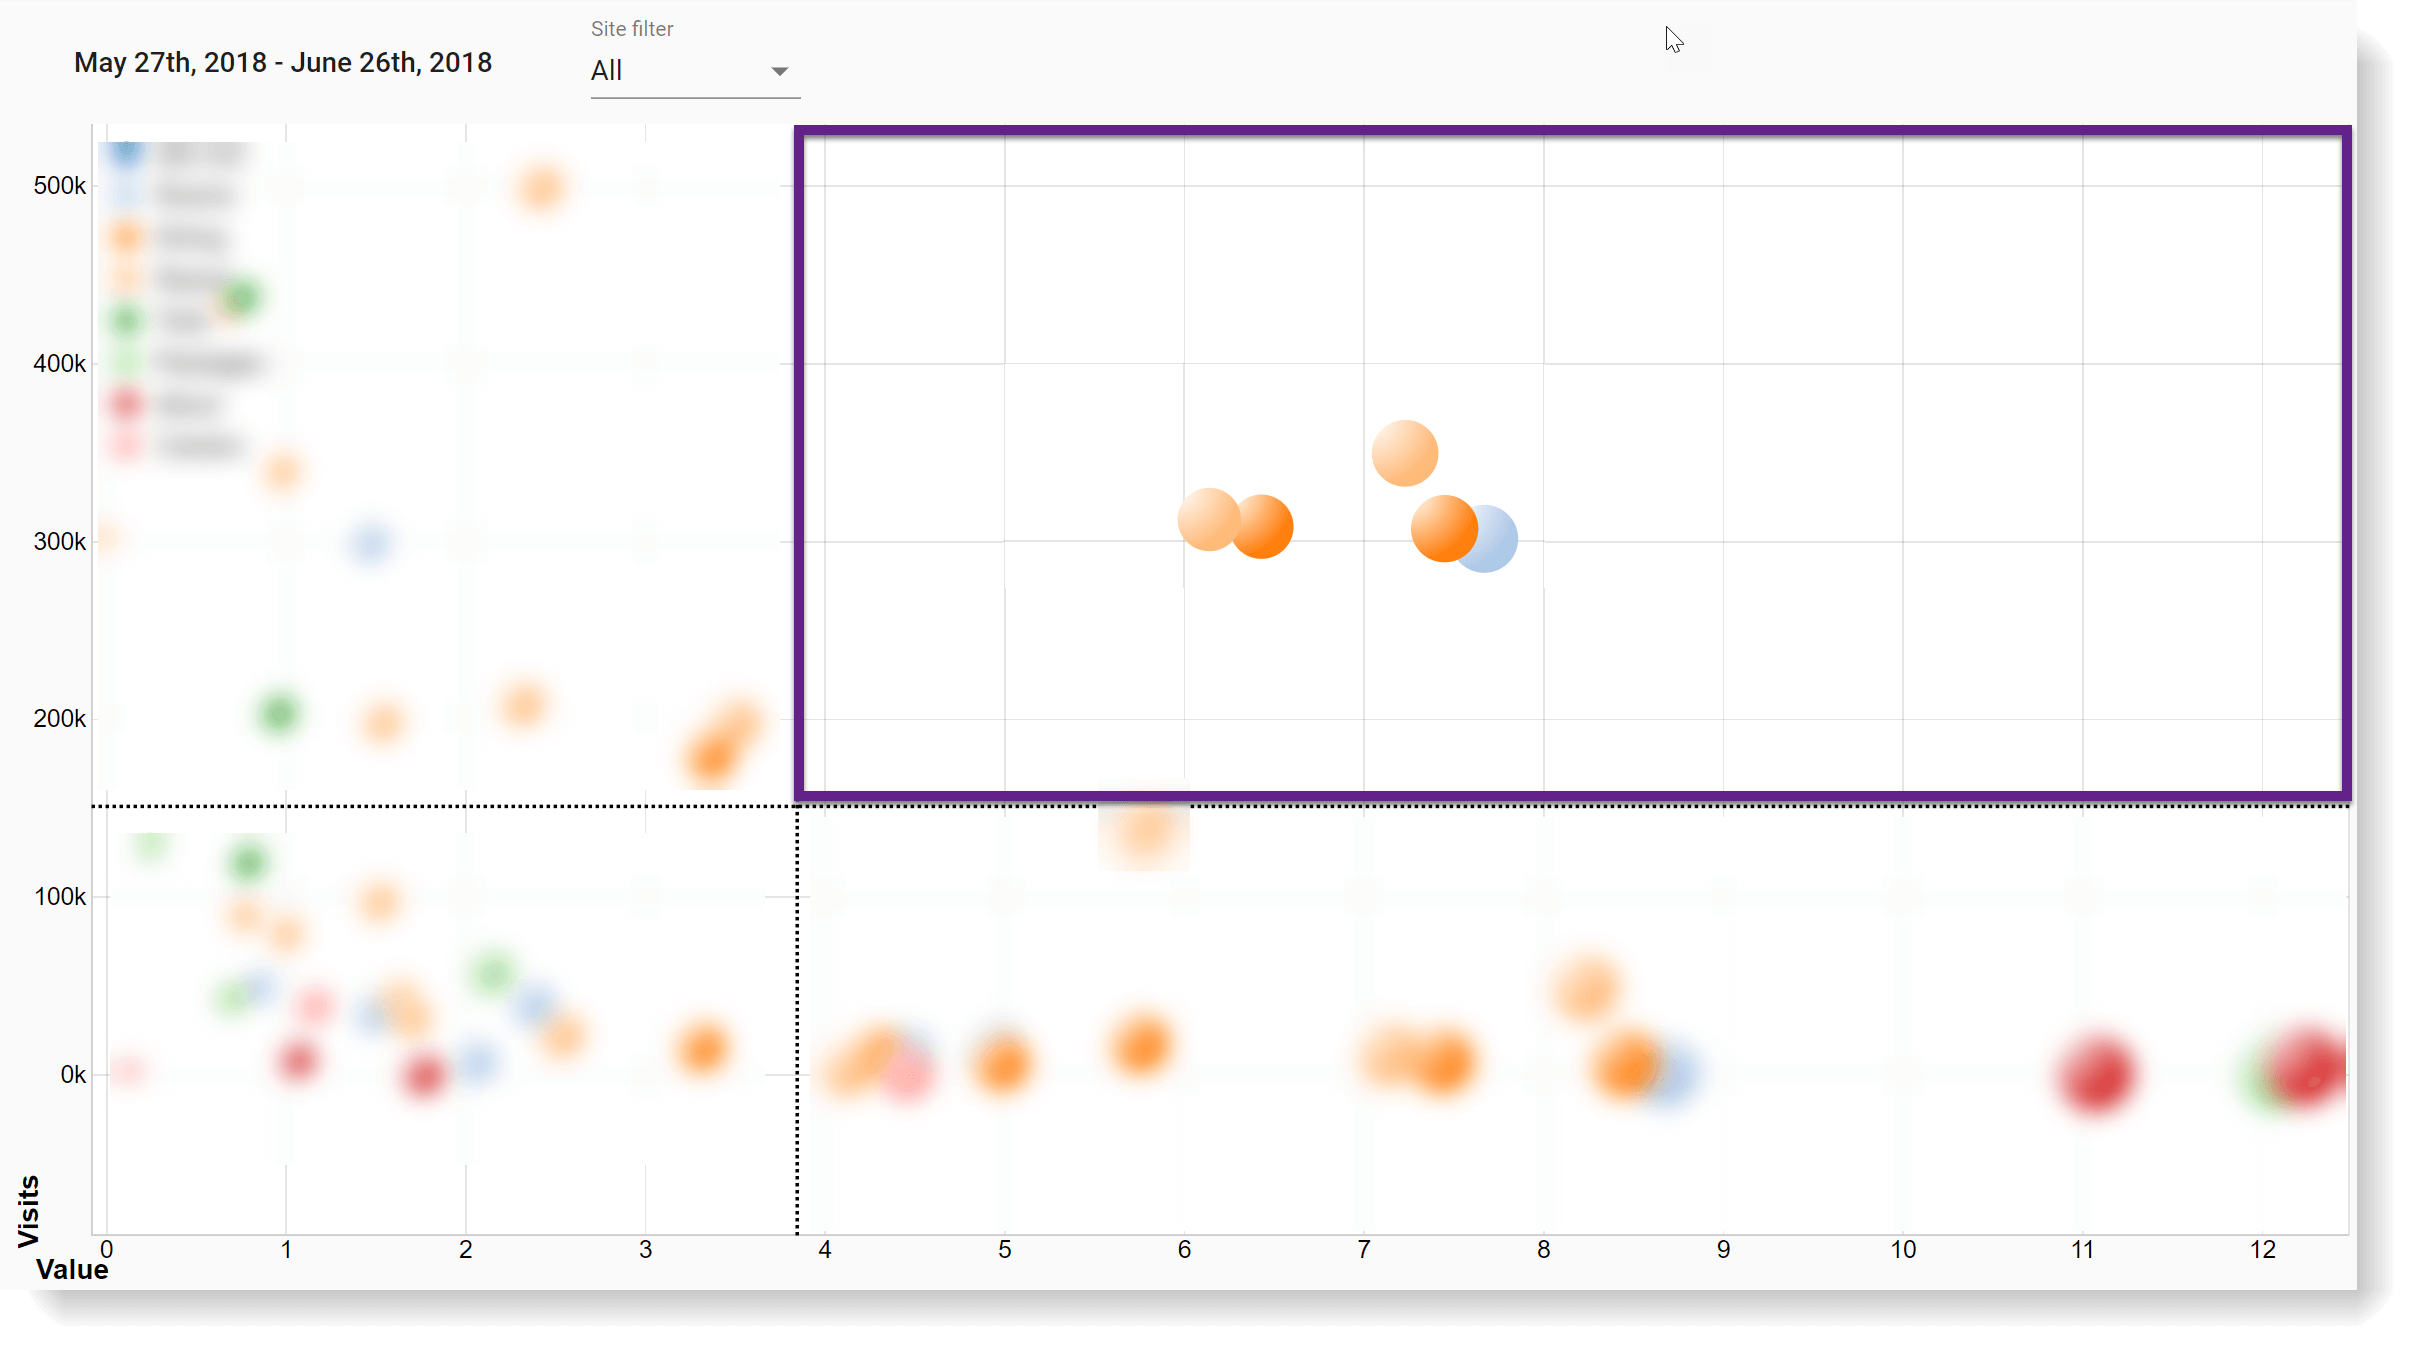
This is your star content, so be sure to maintain both the campaigns that are driving traffic to this and your optimization efforts, which should give you better insights on what is working optimally. Also, consider investing more in driving traffic to the high-value stars (biggest dots). But make sure to evaluate your efforts against what you’re doing with the low-visits, high-value content, since this would typically be the fastest route to increased value.
Based on customer feedback, we’ve added a few additional insights into the module:
- Understand how content value and visits change over time (we even added a play button)
- Categorize your content so you can compare apples to apples and pears to pears
- Calculate the value opportunity, based on moving content, which performs somewhere between below-average and average (the delta between those two multiplied by content visits)
- Provide information about paths leading to the selected content and paths out along with calculated engagement value leakage from Sitecore Path Analyzer.
And since we’ve spent a combined 25+ years working for Sitecore before we started Altola, we’ve added some additional insights for Sitecore Experience Platform customers:
- Show which pages have personalization or tests running (hopefully, a lot of the most-visited ones)
- Show page details that provide a better understanding of your visitors and their behavior, which, in turn, helps increase value by driving recommendations about what content these visitors prefer and should be exposed to
The module is currently in private beta and will be publicly available for Sitecore Experience Platform (8.2 and 9-series) as a basic free version.
Next steps
Head over to our Optimus for Sitecore XP lab page, where you can sign up for the private beta.
We are, of course, more than happy to connect and give a demo or to help you get the full value of the module, based on the analytics tool you are currently using.
For those who would like to do a dive deeper into technological details, stay tuned for the upcoming blog post where our own Todd Mitchell will spill the beans on how it is all put together.
Until next time!